


Semiconductors sold off on Tuesday, crushing the Technology sector. But the Real Estate sector didn’t suffer a similar fate; in fact, it was the top sector performer for the day.
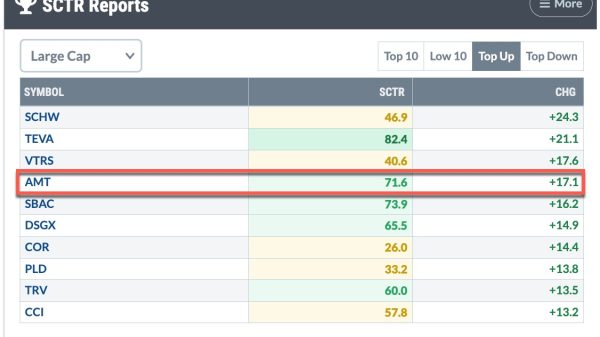
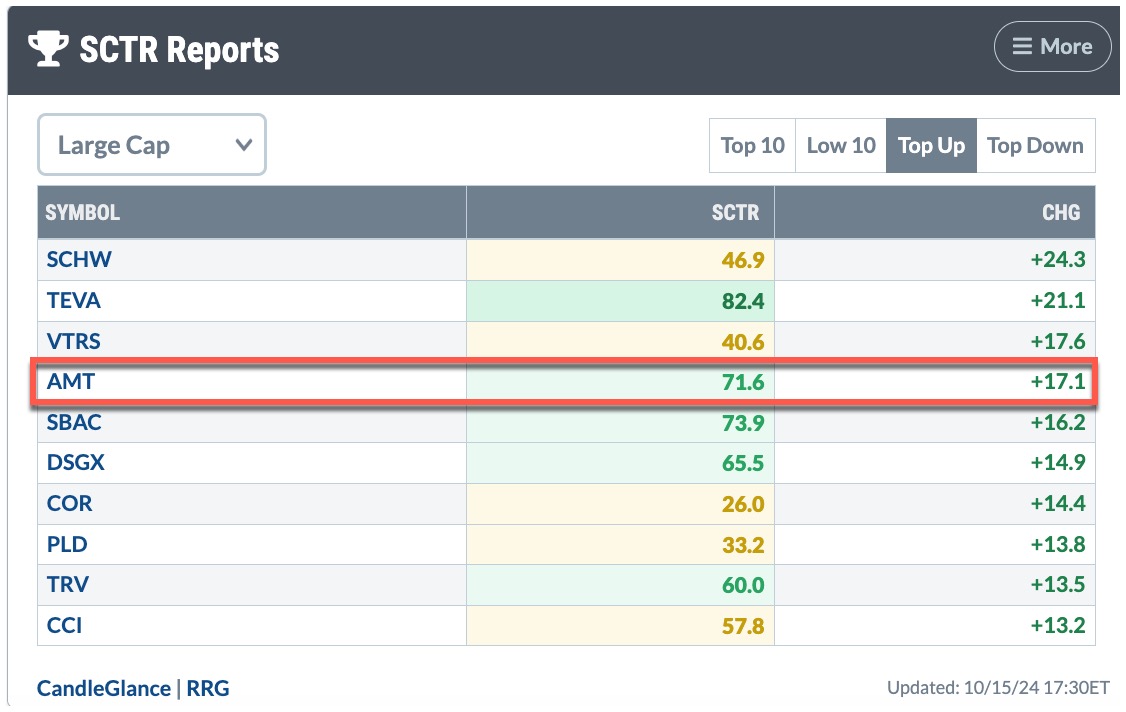
The Real Estate Select Sector SPDR Fund (XLRE) reached a 52-week high in mid-September, but has pulled back since then. However, Tuesday’s price action suggests that XLRE may be on the verge of recovering from correction territory. One of XLRE’s top holdings is American Tower Corp (AMT), which happens to be in the top 5 in the Large Cap Top Up StockCharts Technical Rank (SCTR) category.

FIGURE 1. SCTR REPORT FOR OCTOBER 15, 2024. American Tower (AMT) was in the top 5 in the Large Cap Top Up category.Image source: StockCharts.com. For educational purposes.
AMT operates and leases cellular towers to multiple carriers. As bond yields fall, cell tower Real Estate Investment Trusts (REITs) benefit from lower borrowing costs. And when interest rates decline, AMT’s 2.8% dividend yield may be another reason to own the stock.
Technically Speaking
Looking at the weekly chart of AMT (see below), the stock price is trading above its 26-week simple moving average (SMA) and is trying to stay above its 61.8% Fibonacci retracement level. Its SCTR score is just above 70, and the relative strength index (RSI) is trending higher toward 70.

FIGURE 2. WEEKLY CHART OF AMERICAN TOWER STOCK. The stock price is gaining momentum, so keep an eye on the indicators to ensure momentum is still strong enough to take the stock price higher.Chart source: StockCharts.com. For educational purposes.
The more recent series of higher highs and higher lows is an indication that the trend could continue to go higher. Let’s see what story the daily chart of AMT tells.

FIGURE 3: DAILY CHART OF AMERICAN TOWER STOCK PRICE. The breakout above the 50-day SMA, a potential MACD crossover, and rising OBV all support an upward move in AMT.Chart source: StockCharts.com. For educational purposes.
After bouncing above a support level (blue dashed line), the stock price crossed above its 50-day SMA. It’ll have to show a series of higher highs and higher lows to support the upward trend in price. There needs to be momentum for that to occur, and two good indicators to gauge the momentum are the moving average convergence/divergence (MACD) and On Balance Volume (OBV).
The MACD line could soon cross over the signal line just below the zero line. The closer the crossover is to the zero line, the more confident I feel about the sustainability of the uptrend.
Meanwhile, an OBV crossover above its 50-day SMA would further confirm the uptrend in AMT.
If the price action follows through on the upside, AMT could reach its September 10 high, after which its all-time high would be the next destination. The weekly chart shows a few clear resistance levels along the way.
The one concern is that a head-and-shoulders top could form on the weekly chart. If that were the case, price could fall below the 50% retracement level and 26-week SMA.
Trading AMT
I wouldn’t enter the trade until the price exceeds $234.50 (left shoulder). That gives it time to display a series of higher highs and higher lows on the daily chart. I would place a tight stop below my entry point and stay in the trade if the momentum remains strong. The first target would be the 52-week high. If it exceeds that, I will ride the trend for as long as possible. Once the momentum starts waning, I’d exit my position.
If price moves in the opposite direction, i.e. if a head and shoulders top is formed on the weekly chart, all bets are off. I’d delete this chart from my ChartList. There are plenty of other opportunities.
The bottom line: Set an alert for when AMT crosses above $234.50. When you get the notification, head over to the weekly and daily charts of AMT, which should be saved in one of your ChartLists, and revisit the indicators. Are they still showing bullish momentum? If so, enter a long position, but know where your stops are before you place the trade.

Disclaimer: This blog is for educational purposes only and should not be construed as financial advice. The ideas and strategies should never be used without first assessing your own personal and financial situation, or without consulting a financial professional.