Connect with us

Hi, what are you looking for?

Prime Webinar GroupPrime Webinar Group

Editor's Pick

50% of S&P 500 Stocks Just Turned Bullish – What Happens Next?

Bullish signal alert! Over 50% of S&P 500 stocks are now above their 200-day moving average.

In this video, Dave explains this key market breadth indicator and what it means for stock market trends. He shows how moving average breadth has reached a bullish milestone, what this means based on historical signals over the past 15 years, and how it compares to the Zweig Breadth Thrust. He also introduces the stoplight market phase technique—a simple but effective method using StockCharts tools to assess market conditions in real time.

This video originally premiered on May 13, 2025. Watch on StockCharts’ dedicated David Keller page!

Previously recorded videos from Dave are available at this link.

You May Also Like

Politics

Iranian Supreme Leader Ayatollah Ali Khamenei on Tuesday called U.S. demands that Tehran stop enriching uranium entirely ‘utter nonsense’ and questioned whether future nuclear talks could succeed. ...

Politics

Secretary of Defense Pete Hegseth is instructing the Pentagon to launch a comprehensive review into the U.S. withdrawal from Afghanistan in 2021.  In 2021,...

Editor's Pick

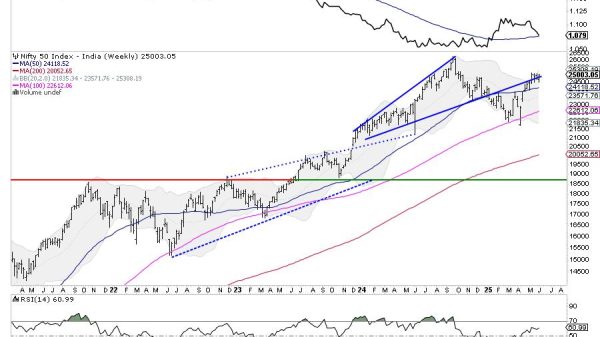
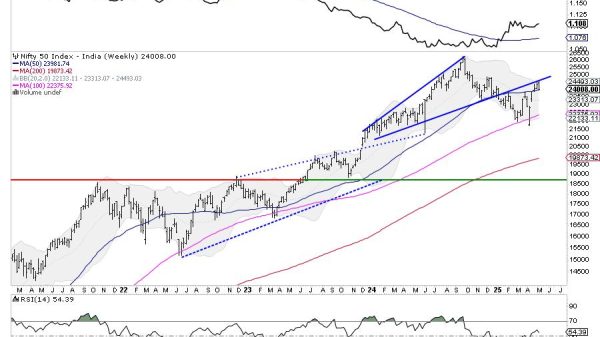
Amid ever-increasing uncertainties on the global front and similarly rising geopolitical tensions between India and Pakistan, the Indian equity markets demonstrated strong resilience. They...

Politics

The State Department said nuclear talks between the U.S. and Iran have been constructive, and President Donald Trump has been clear about wanting to...