While the S&P 500 and Nasdaq 100 have been holding steady into this week’s Fed meeting, warning signs under the hood have suggested one of two things is likely to happen going into Q1. Either a leadership rotation is amiss, with mega cap growth stocks potentially taking a back seat to other sectors, or a risk-off rotation is coming where investors rotate to defensive positions.
A quick review of the Bullish Percent Indexes can help us review how the resilience of the markets can be attributed to the continued strength of the Magnificent 7 and related names. Today we’ll compare breadth conditions for the S&P 500 and Nasdaq 100, and update some key levels to watch into year-end and beyond.
The S&P 500 Bullish Percent Index is a breadth indicator driven by point and figure charts. This data series basically reviews 500 point & figure charts and shows what percent of the stocks have most recently generated a buy signal. I’ve found the Bullish Percent indexes to be most valuable around major market tops, because a downturn in a breadth indicator such as this can only happen if lots of stocks are pulling back in a fairly significant fashion.

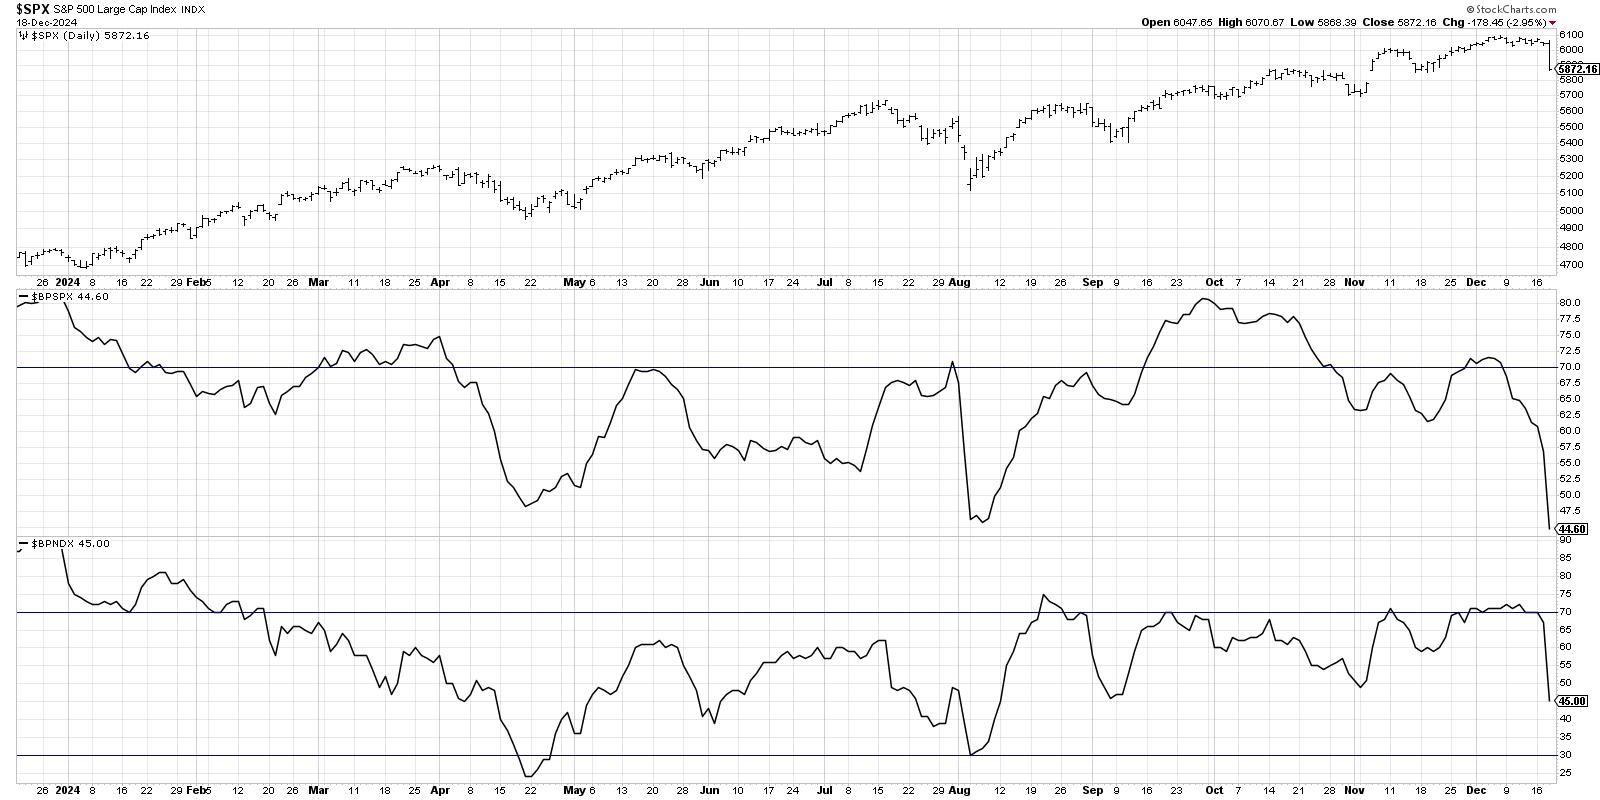
Here we’re showing the S&P 500 index for the last 12 months along with the Bullish Percent Index for the S&P 500 as well as the BPI for the Nasdaq 100. Note that toward the end of September, the S&P 500’s BPI was around 80% while the Nasdaq’s was around 70%.
Going into this week, the S&P 500’s BPI had pushed down to around 60%, while the Nasdaq 100’s BPI was still around that 70% level. This change of character is due to the fact that large cap growth stocks have remained largely constructive, while some of the most important breakdowns we’ve witnessed in recent weeks have been in more value-oriented sectors.
This divergence between the two Bullish Percent Indexes tells us that the S&P 500 and Nasdaq 100 have not remained strong because of broad support from a variety of sectors, but more because of concentrated support from a limited number of growth sectors like technology.
As the market is reeling this week in reaction to the Fed’s expectations for further rate cuts into early 2025, we can see that both of the Bullish Percent Indexes have now pushed below the 50% level for the first time since the August market correction. This means we need to focus on a key “line in the sand” for the S&P 500 and to attempt to better define market conditions.

The SPX 5850 level has been the most important support level in my work, based on the fact that a break below that key pivot point would mean the S&P 500 has made a lower low. We haven’t seen that sort of short-term weakness since the August pullback. While the initial downturn post-Fed has pushed the SPX down toward the 5850 level, we would need to see a confirmed break below that point to unlock potential further downside targets.
Our latest video on StockCharts TV breaks down the Bullish Percent Index chart above, along with four key stocks reporting earnings this week. While those charts will all most likely be affected by this week’s Fed announcement, earnings still matter! I will be watching important levels of support in all four of those names, and I’d encourage you to leverage the alert capabilities on StockCharts to ensure you don’t miss the next big move!
RR#6,
Dave
PS- Ready to upgrade your investment process? Check out my free behavioral investing course!
David Keller, CMT
President and Chief Strategist
Sierra Alpha Research LLC
Disclaimer: This blog is for educational purposes only and should not be construed as financial advice. The ideas and strategies should never be used without first assessing your own personal and financial situation, or without consulting a financial professional.
The author does not have a position in mentioned securities at the time of publication. Any opinions expressed herein are solely those of the author and do not in any way represent the views or opinions of any other person or entity.


